

Stocks Details Page
The stocks detail page provides various indicators, stats and proprietary rankings to help you quickly understand the trend, momentum and price action of the stock.
Let's look at the page in sections.
Stock Rankings and Chart Section
See the screenshot below.
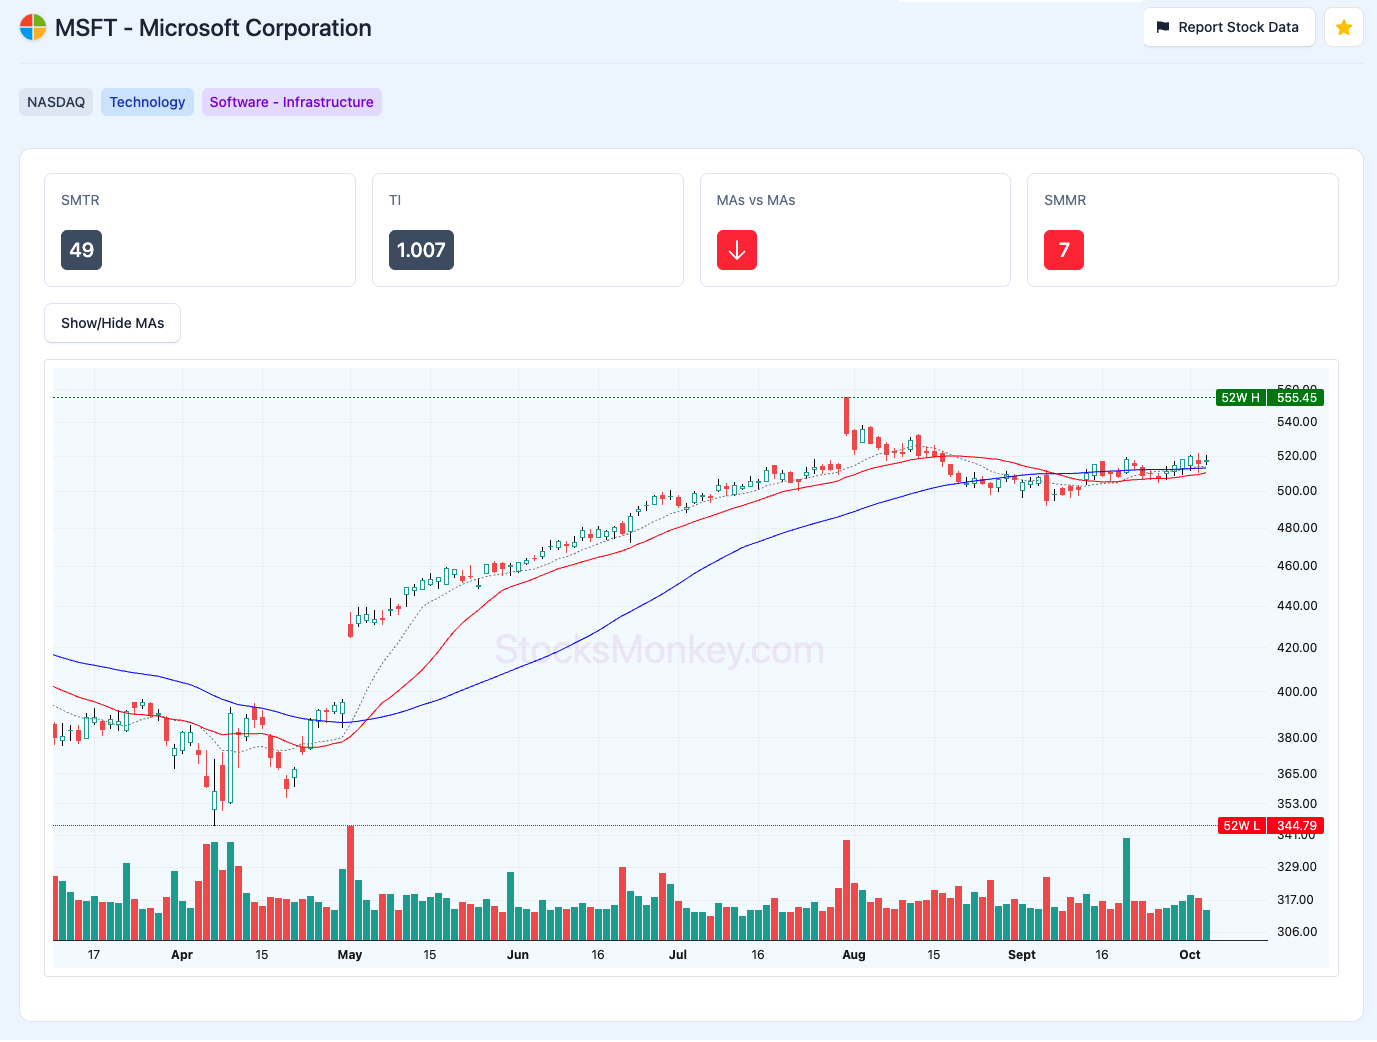
The top section provides the stock name and ticker/symbol plus it's exchange, sector and industry.
You can also see the 'report stock data' and 'favourite stock' buttons on the top right.
On the next line are four important measurements that provide you with a quick way to assess the stocks current health and personality:
- SMTR - StocksMonkey Trend Rank - rank between 0-99 with 80+ being stocks that should be trending in the past weeks/few months. More information on SMTR can be found here.
- TI - Trend Intensity - this is a another measure of trend that uses a weighted average of short/medium Moving Averages. A value >= 1.05 is marked green and may show an up-trending stock. value <= 0.95 is marked red and may show a down-trending stock. More information on TI can be found here.
- MAs vs MAs - this will display a green up arrow if all moving averages are in correct order with the 10SMA, 20 SMA, 50 SMA and 200SMA aligned. If any are out of order then a red down arrow is displayed.
- SMMR - StocksMonkey Momentum Rank - rank between 0-99 with 80+ being stocks that are displaying stronger upward momentum in the past weeks and months. More information on SMMR can be found here.
The chart display plots daily candle data from the last year. It also plots the 10 SMA, 20 SMA and 50 SMA lines, volume and 52 week high and low value lines.
The moving averages can be toggled using the button above the chart.
Key Information Section
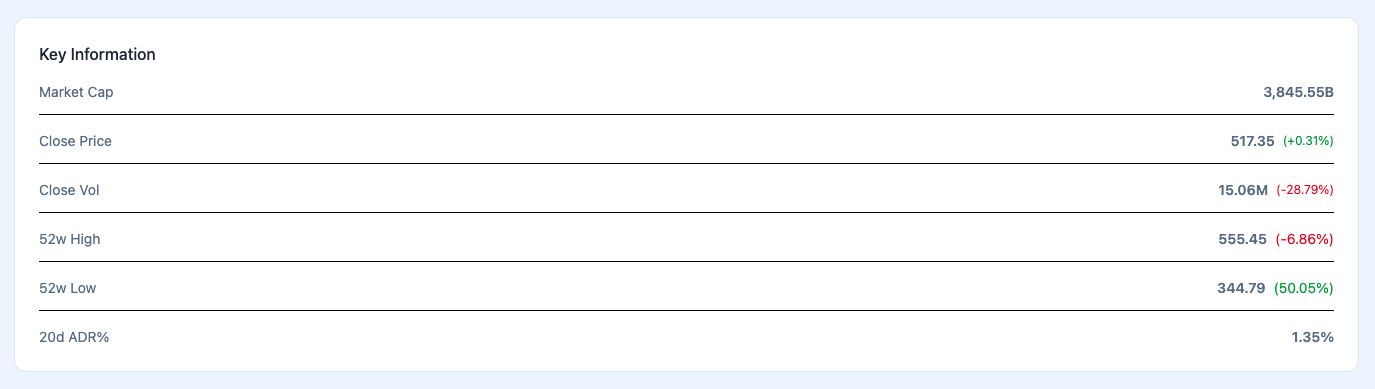
The next section provides key information about the stock including the latest market capitalisation, close price, close volume, 52w High and 52w low values and the 20 day Average Daily Range percentage (20d ADR%).
For the price and volume, the numbers in brackets show the percentage change compared to previous close/day.
For the 52w High and Low, the numbers in brackets show the percentage amount that the stocks current value is away from the 52 week high and lows.
Trend Section
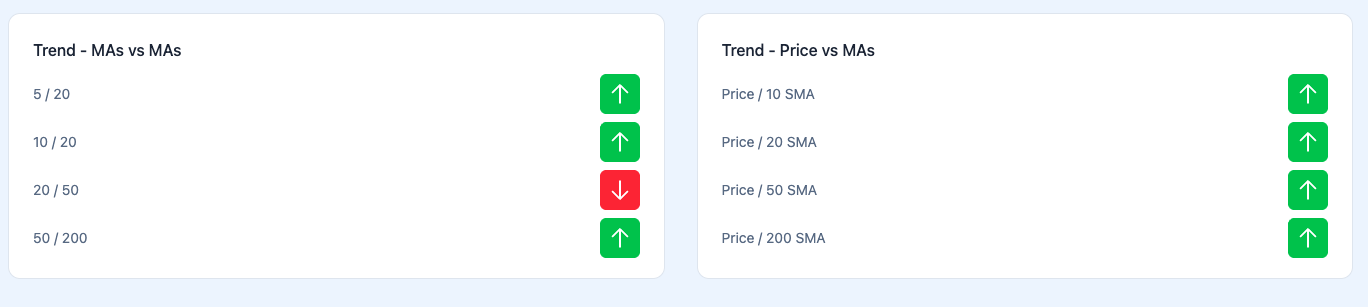
The next section provides more detail on the stocks trend.
The left column indicates if key simple moving averages (SMAs) are currently above each other or not.
The right column indicates if the stocks price is currently above the key moving averages or not.
Price Section
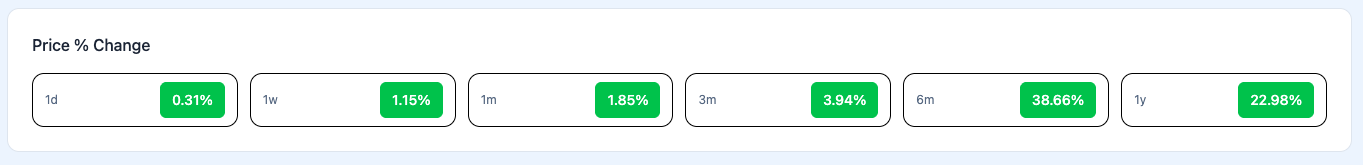
The price section provides percentage change (gain in green, loss in red) between latest price close and various timeframes - a day ago, week ago, 1 month, 3 months, 6 months and 1 year. Again this provides a quick view of a stocks growth and momentum.
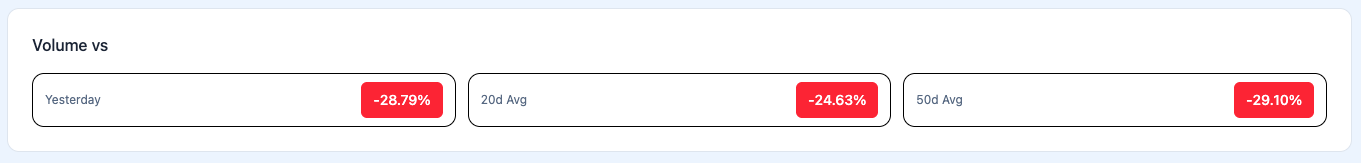
Volume Section
The volume section provides percentage change (gain in green, loss in volume) between latest volume close and several key measurements. These are yesterdays closing volume, the 20 day average volume and the 50d average volume.
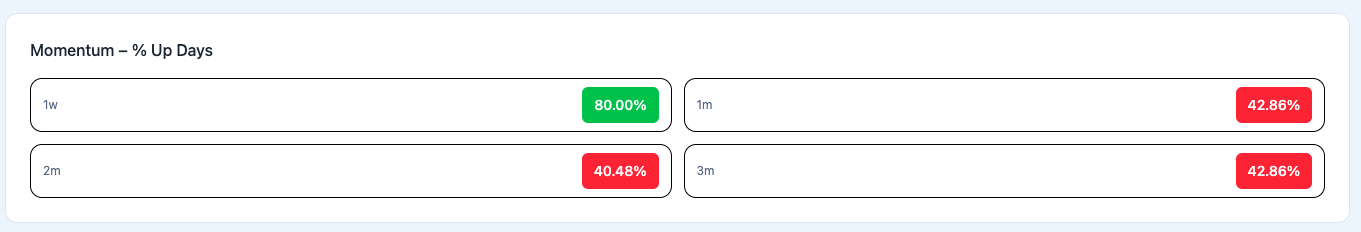
Momentum Section
The momentum section displays the percentage of up/positive days over several different periods - past week, months, two months and three months. If the percentage of up-days is >= 50% then the background is green, else it's red. This provides you with a quick way to establish short and medium term momentum.
About Section
The about section provides a summary of the stocks key history and business areas. Also included are the companies address, link to its website and the IPO (initial public offering) date. This is the date when the stock was first listed on the stock exchange.

News section
The news section lists the latest 20 news items for the stock - with the latest news items listed first. You can click on each item to enable you to read the full news item.
Please note that news items are only available for certain Worldwide exchanges.